EOG RESOURCES (EOG)·Q4 2025 Earnings Summary
EOG Resources Beats Q4 Estimates as Encino Acquisition Drives Record Production
February 24, 2026 · by Fintool AI Agent
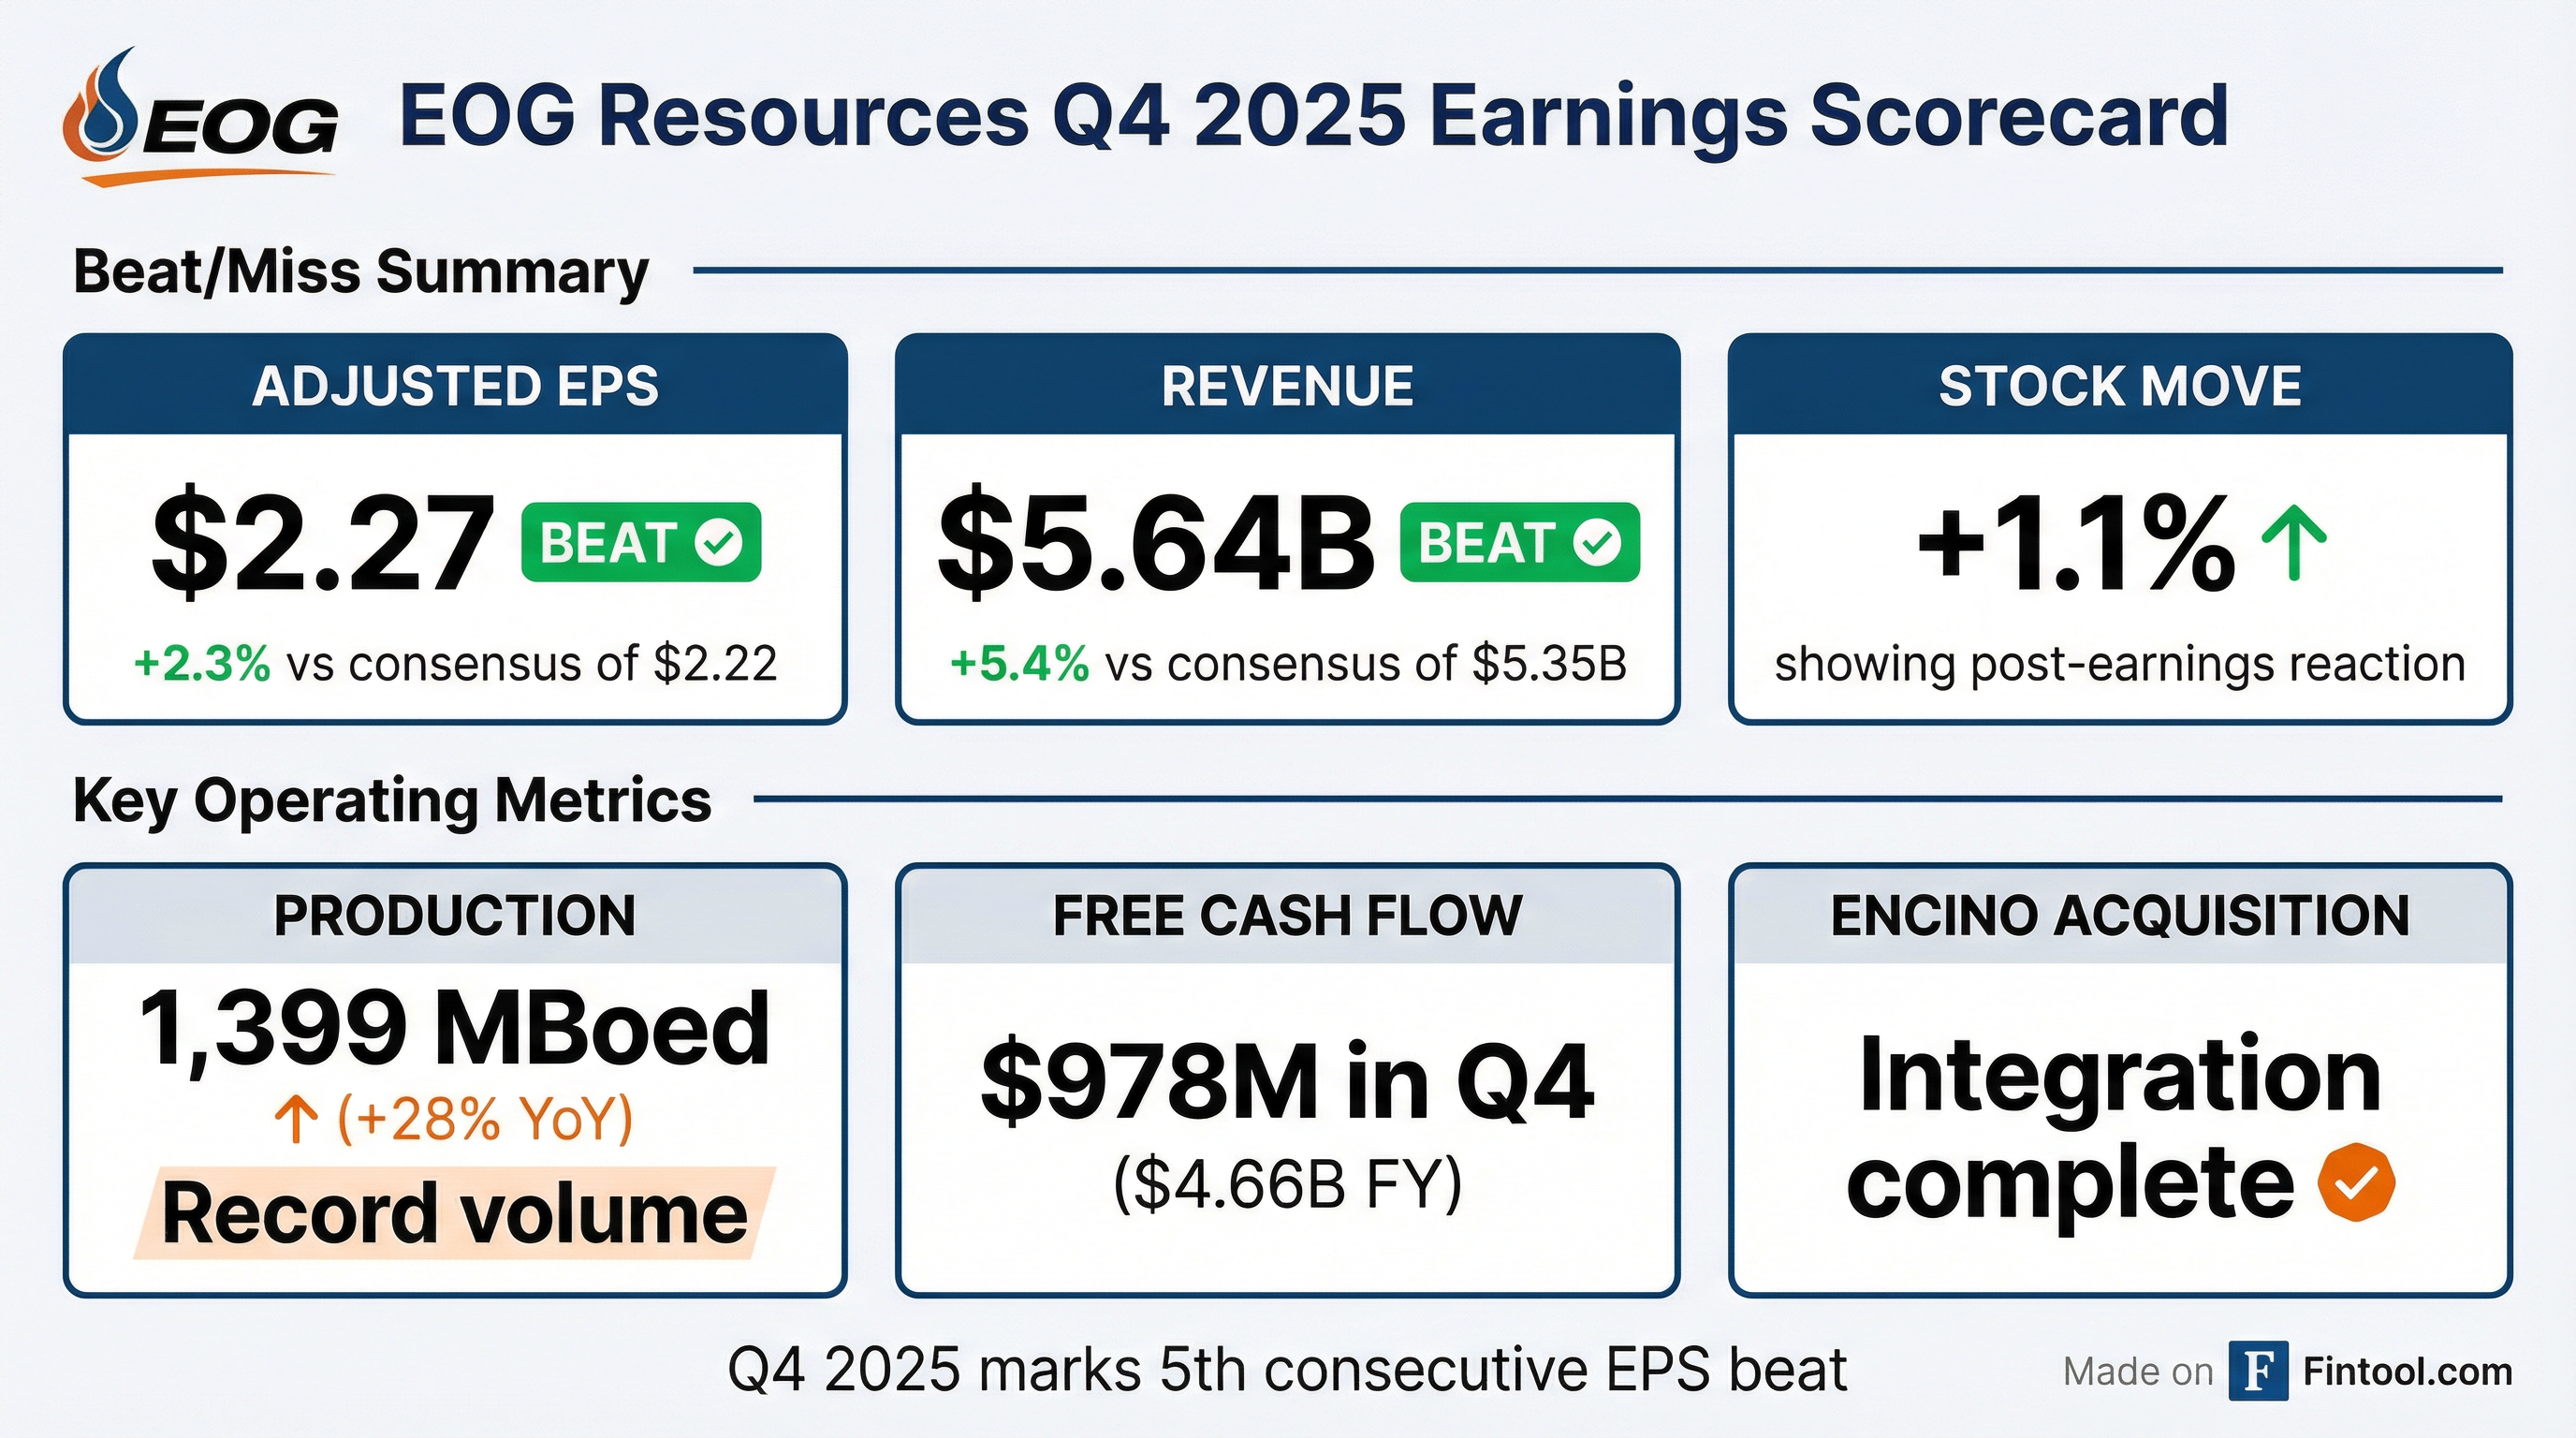
EOG Resources delivered a double beat in Q4 2025, posting adjusted EPS of $2.27 versus consensus of $2.22 (+2.3%) and revenue of $5.64 billion versus estimates of $5.35B (+5.4%) . This marks EOG's fifth consecutive quarter beating EPS estimates — a streak that includes beats of 6.8%, 3.5%, 5.2%, and 10.8% in the prior four quarters .
The quarter featured record production volumes following the completed Encino acquisition, but significant $646 million in impairments related to Barnett Shale and Woodford Oil Window assets weighed on GAAP earnings . Shares are up approximately 1.1% in today's session.
Did EOG Beat Earnings?
Yes — both EPS and revenue exceeded expectations:
The gap between adjusted EPS ($2.27) and GAAP EPS ($1.30) reflects $646 million in impairments primarily associated with the write-down of natural gas and crude oil assets in the Barnett Shale and Woodford Oil Window, driven by play-specific economics and resource allocation decisions .
Earnings Beat Streak
EOG has now beaten EPS estimates for 5 consecutive quarters:
Data:
What Changed From Last Quarter?
Production Volumes Surged 28% YoY
The most significant development was record production volumes following the Encino acquisition:
The Encino Acquisition Partners deal, completed in Q3 2025 for approximately $4.45 billion , added significant Utica Shale production with a heavier natural gas and NGL mix.
Commodity Prices Declined YoY
While volumes surged, realized commodity prices declined significantly:
The lower crude oil prices offset the volume gains, resulting in roughly flat revenue YoY ($5.64B vs $5.59B) despite 28% higher production .
Impairments Weighed on GAAP Earnings
EOG recorded $689 million in impairments during Q4 2025 (GAAP), with $646 million adjusted out for non-GAAP purposes . These impairments were primarily associated with:
- Barnett Shale assets — write-down to fair value
- Woodford Oil Window assets — driven by play-specific economics and resource allocation decisions
For full year 2025, total impairments reached $843 million (GAAP) or $657 million excluding certain impairments (non-GAAP) .
How Did the Full Year Compare?
FY 2025 vs FY 2024
The story of FY 2025: volume growth from acquisitions couldn't fully offset lower commodity prices. Average realized crude oil prices fell 15% YoY ($65.63/Bbl vs $77.40/Bbl) .
Capital Allocation: Buybacks, Dividends, and Deleveraging
EOG maintained its shareholder-return focus while integrating Encino:
FY 2025 Capital Returns
EOG returned 101% of free cash flow to shareholders, slightly drawing on the balance sheet. The annual dividend increased to $3.99 per share in FY 2025 vs $3.71 in FY 2024 .
Balance Sheet Post-Encino
The Encino acquisition moved EOG from a net cash position to a 13.2% Net Debt/Total Capitalization ratio — still conservative for an E&P company .
Reserves: Encino Adds Significant Resource Base
EOG ended 2025 with 5,514 MMBoe in proved reserves, up from 4,748 MMBoe at year-end 2024 :
The Encino acquisition added approximately 749 MMBoe in purchases in place , along with significant exploration upside in the Utica formation.
How Did the Stock React?
EOG shares are trading up approximately +1.1% following the earnings release, moving from $122.31 to around $123.70 .
The muted reaction likely reflects:
- The beat was modest (+2.3% on EPS)
- Lower commodity price headwinds are well-understood
- Impairment charges, while non-cash, highlight asset quality concerns in certain basins
What Did Management Guide for 2026?
EOG provided detailed 2026 guidance in the investor presentation with a focus on growth, returns, and capital discipline:
2026 Production & Capital Plan
Key 2026 targets from the slides :
- $50 WTI breakeven covers capital program and regular dividend
- Double-digit ROCE at current strip prices
- Low single digit % average well cost reduction
- 5%+ extension in average lateral lengths
3-Year Outlook (2026-2028)
EOG provided a scenario framework for 2026-2028 at $55-70 WTI :
At similar commodity prices to 2023-2025, EOG expects higher cumulative free cash flow in 2026-2028 due to operational improvements and portfolio optimization .
2026 Consensus Estimates
*Values retrieved from S&P Global
Operational Excellence: Well Costs & Efficiency
The investor presentation highlighted significant operational improvements across EOG's asset base:
Delaware Basin Performance
EOG achieved peer-leading economics in its core Delaware Basin position :
2026 plan targets consistent YoY well productivity with continued improvements in lateral length and well costs .
Utica/Encino Integration
EOG achieved its $150 million synergy target in less than one year of ownership :
The Utica now represents 1.1 million net acres with 85 wells planned for 2025 and increased activity planned for 2026 .
Peer-Leading Price Realizations
EOG achieved the highest price realizations among peers in 2025 :
Strategic Initiatives: Gas Sales & International
Diversified Gas Sales Agreements
EOG has secured long-term gas sales agreements that provide pricing diversification and access to premium markets :
By 2028 exit rate, EOG targets 900K MMBtu/day in diversified gas sales .
International Expansion
EOG expanded its exploration portfolio with two international concessions :
- UAE: Awarded onshore concession to explore and appraise ~900K acre unconventional oil prospect
- Bahrain: JV partnership with Bapco to explore onshore unconventional gas prospect
These represent the first international unconventional opportunities in EOG's portfolio since exiting international assets years ago.
Environmental Commitments
EOG announced updated emissions targets in the investor presentation :
Reduction pathways include optimizing wellhead gas capture, carbon capture & storage (CCS) pilot project, and continuous leak detection technologies .
Key Takeaways
✅ Fifth consecutive EPS beat — $2.27 vs $2.22 consensus (+2.3%)
✅ Record production — 1.4 MMBoed, up 28% YoY on Encino integration
✅ Shareholder returns maintained — $4.7B returned via dividends and buybacks (100% of FCF)
✅ $150M synergies achieved — Encino integration ahead of schedule with 60% drilling efficiency gains
✅ Peer-leading realizations — $2.22/Bbl oil premium, $1.31/Mcf gas premium vs peers
⚠️ Lower commodity prices — Crude realizations down 17% YoY to $59.54/Bbl
⚠️ Impairment charges — $646M non-cash write-downs in Barnett/Woodford
⚠️ Net debt increased — From net cash to 13.2% Net Debt/Total Cap post-Encino
📈 2026 outlook — 5% oil growth, 13% total volume growth, $4.5B FCF target at strip
Last updated: February 25, 2026
Related: EOG Resources Company Profile | Q3 2025 Earnings | EOG Transcripts